

You’ve probably heard the line, often attributed to Peter Drucker: “If you can’t measure it, you can’t improve it.” You’ve taken your app from an idea through design, development, testing, and marketing. It’s live in the app stores, and downloads are coming in. That’s a milestone but it’s not the finish line, and it’s not proof of success.
One way to think about it: downloads mostly measure curiosity, not commitment, some installs come from genuine interest, but plenty come from ads, incentives, or a friend’s recommendation rather than the app itself. Either way, a download alone doesn’t tell you whether people are actually using your app, whether it’s making money, or whether something is quietly driving users away.
That’s where mobile app metrics come in. As a founder, those are the questions your metrics need to answer and the difference between tracking numbers and tracking the right numbers is the difference between guessing and deciding.
 Many of the ideas in this guide are drawn from Beyond the Download, Technology Rivers CEO Ghazenfer Mansoor’s book on building and growing successful mobile apps. One of the book’s central themes is that a download is a milestone, not a verdict. As Ghazenfer writes:
“But downloads are only the beginning”
That’s the entire premise of this guide: downloads tell you curiosity happened, not whether the app is working. Metrics are how you find out the difference.
This guide covers mobile app metrics that matter most, how to find the “why” behind them, and which tools are worth your team’s time right now. In addition to the tracking tools and methods covered in this article, we’re also sharing some ideas about the ways you can make your app sticky and strategies you can use to battle mobile app competition.
- Mobile App Retention Strategies: How to Keep Users Engaged After Download
- 6 Ways to Battle Mobile App Competition
Mobile App Metrics That Matter
There’s no single correct scorecard. But every metric worth your attention as a founder answers a decision-level question. Here’s how to think about mobile app metrics, grouped by function.
Acquisition
Downloads. The raw count of installs. Not everything, but it’s the top of your funnel, and tools like Apple iOS Analytics, Data.ai, and Priori Data can help you track where they’re coming from.
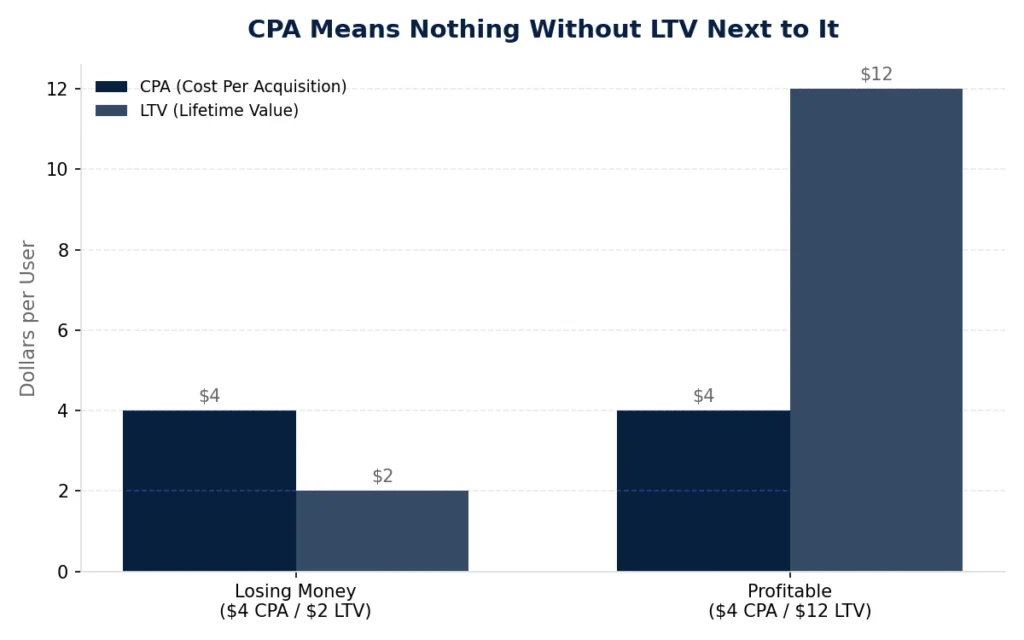
Cost Per Acquisition (CPA). Your user acquisition cost: what you’re spending, on average, to get one new user through your marketing and ads. CPA means nothing in isolation. It only becomes useful next to Lifetime Value (covered below).
To take a hypothetical: if it costs you $4 to acquire a user who only ever generates $2 in value, you’re losing money on every single download and growing faster just means losing money faster. Knowing this ratio early is one of the most important financial checks you can run on your app.
Engagement
Daily Active Users (DAUs). How many people open your app on an average day.On its own, DAU can be a vanity number, some teams treat it as a core KPI, and in the right context it is one.
What makes it useful is DAU relative to your total installs: if 50,000 people have downloaded your app but only 800 open it on a given day, that usually points to people not coming back on their own, though onboarding gaps, seasonal use, or notification issues can produce the same pattern worth ruling those out before assuming it’s a habit problem.
Average Visit Time. How long a typical session lasts. This one depends heavily on category: a longer session can mean people are engaged and completing tasks, buying something, or consuming content but for banking, weather, or authentication apps, a shorter session is usually the sign of a job done well. Know which kind of app you’re running before you set a target, or you’ll optimize for the wrong direction.
User Activity. Which screens people visit, in what order, and where they stop. Tools like UXCam make this visible, this is where you find out whether people are using the features you bet the roadmap on, or ignoring them.
It’s the kind of thing clients bring up unprompted:
“They know how to make apps more engaging, and they’ll help you understand your product with a new perspective.” – Beverly Klau, Founder & CEO, Verbina
Retention & Health
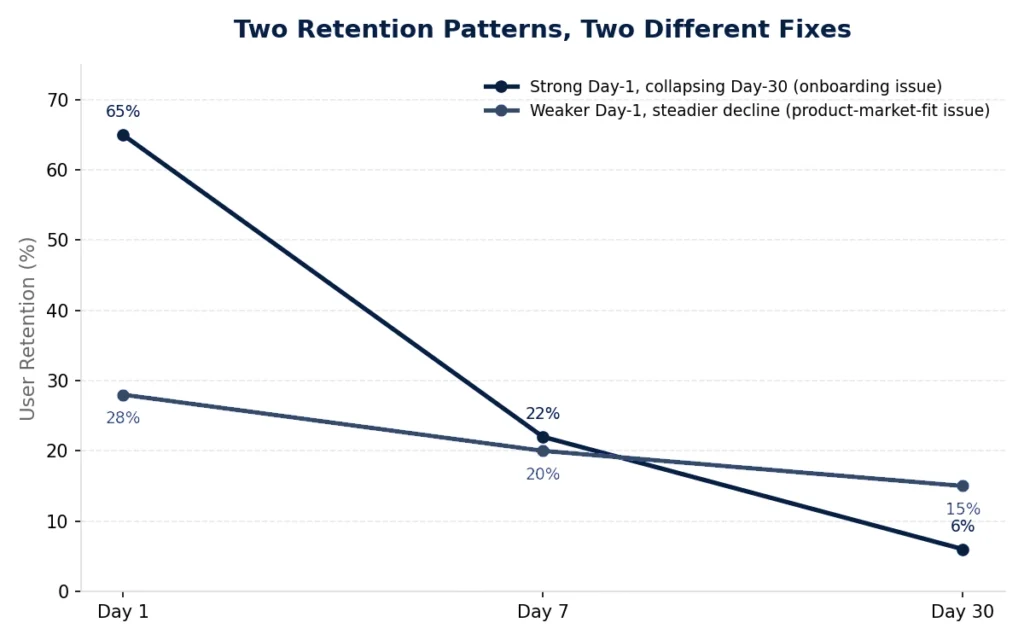
Retention Rate. Your app retention rate: the percentage of users who return after their first use. Track this at Day-1, Day-7, and Day-30 checkpoints rather than as a single number, a strong Day-1 rate with a collapsing Day-30 rate points to an onboarding or activation problem, while the reverse pattern usually points to a product-market-fit issue you won’t see in Day-1 alone.
App Churn. The percentage of users who stop using your app over a given period. Read these two together. One useful pattern to watch for: if churn is rising while your retention numbers look flat, that often points to who you’re acquiring, not how existing users feel, a marketing channel bringing in people who were a weaker fit for the product from the start, rather than happy users suddenly turning unhappy.
It’s not the only explanation, onboarding changes, seasonality, or pricing changes can produce the same pattern but acquisition mix is the one founders miss most often. Same symptom, but the fix is different: one points you toward your marketing channels, the other toward your onboarding flow.
Monetization
Average Revenue Per User (ARPU). How much revenue the average user generates. Watch this alongside CPA: if ARPU is rising while CPA holds steady, you’ve found room to spend more on acquisition profitably, most founders discover this too late, after they’ve already under-invested in growth.
Return on Investment (ROI). Whether the money going in is producing more money coming out, across the whole operation. This is the number that tells you whether to keep funding the current strategy or change it, not a report to check quarterly, but a signal to act on.
Lifetime Value (LTV). The total value one user brings over their entire time with your app.
A caution founders learn the hard way: LTV is a projection, and it’s only as trustworthy as the retention data behind it. Calculate it in month two with thin data and you’re not measuring, you’re guessing with a spreadsheet. Let your retention numbers mature before you make big spending decisions based on LTV.
Audience
Platform & Device. Which platforms and devices your users are on (not to be confused with acquisition source, like paid vs. organic, this is about iOS vs. Android, phone vs. tablet). This is a resource-allocation question in disguise. To take a hypothetical: if 80% of your revenue came from iOS, that’s a real input into whether your small team should keep splitting effort across two platforms, or double down where the business actually is.
Demographics. Who your users are: age, location, and how they found you. For a founder, this is a product-market-fit check, if the people paying for your app aren’t the people you built it for, that gap is either a problem to fix or an opportunity you haven’t priced in yet. If you’re raising or plan to, it’s also part of the story you’ll be telling investors.
Quality & Sentiment
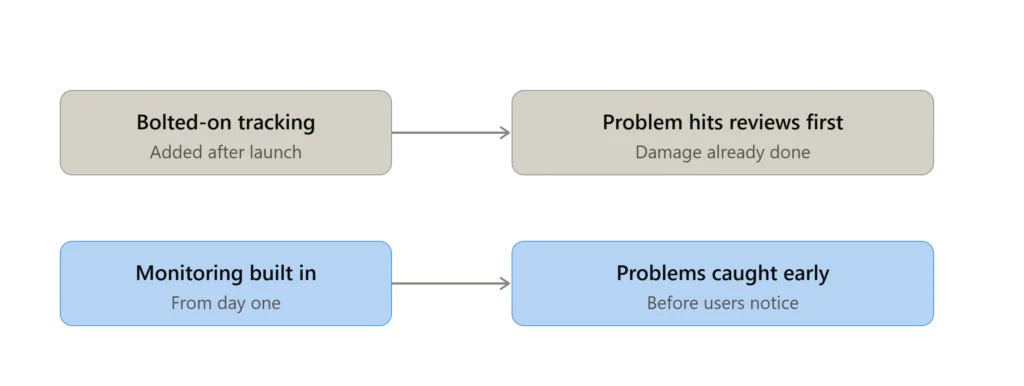
Crash Tracking. How often the app fails, for whom, and why. Nothing drives users away faster, and nothing shows up in reviews quicker, tools like Firebase Crashlytics and UXCam catch it before your users have to tell you about it.
Net Promoter Score (NPS). Satisfaction measured by directly asking users how likely they are to recommend your app, using something like Delighted.
Star Rating / Reviews. What every potential user sees before deciding whether to download. Appbot is a common way to track this without checking the app stores manually.
The useful pairing here: reviews are public and lagging by the time a problem shows up as a one-star review, it’s been hurting you for a while. NPS is private and on-demand. Use NPS to catch dissatisfaction early, before it becomes visible in the store.
Finding the ‘Why’: Behavioral Analytics
Everything above tells you what’s happening in your mobile app metrics. To make good decisions, you also need to know why and that’s what behavioral analytics gives you: a view of how people actually move through your app, where they complete the task they came for, and where they get stuck instead.
Two techniques do most of the work:
Cohort Analysis. Splitting users into groups (say, everyone who joined in March, or everyone who came from a specific ad campaign) and comparing how each group behaves over time. This is how you catch problems that averages hide. A concrete example: if Day-7 retention quietly drops only for users from one acquisition channel, cohort analysis surfaces that in weeks, without it, the problem hides inside your blended average until it’s expensive.
A/B Testing. Showing two versions of something (an onboarding flow, a button, a pricing screen) to two different groups and measuring which performs better.
As Ghazenfer Mansoor puts it in Beyond the Download, behavioral analytics isn’t about reporting what already happened, it’s about spotting what’s coming next, early enough to act on it.
The Tools Worth Using Right Now
The market for app analytics tools shifts fast: platforms get acquired, rebranded, or shut down outright. What follows is a current, working set, representative of what’s out there, not an exhaustive list. Amplitude and PostHog are reasonable alternatives to several of these; the point isn’t that these six are the only options, it’s that they’re mapped to the decisions you’re actually trying to make:
Firebase Analytics / Google Analytics. Your engagement and activity baseline: user counts, characteristics, and navigation paths. Especially useful if you want one tool covering both your website and your app.
Mixpanel. Real-time behavioral analysis and funnels, the workhorse for cohort analysis and understanding the “why” behind user actions. Where Firebase tells you what users did in aggregate, Mixpanel is built for slicing that data by cohort and campaign. Turn to it once “what happened” isn’t enough and you need to know to whom, and why.
UXCam. Session replays and heatmaps: literally watching (anonymized) how users move through your app, which surfaces friction that dashboards miss.
RevenueCat. Subscription management and revenue analytics. This is the one to bring in once subscriptions become your actual growth constraint, not before.
AppsFlyer. Attribution: knowing which marketing channels actually produced the users, so your CPA numbers are tied to reality instead of guesswork.
Appbot. Review and sentiment monitoring at scale, so store feedback reaches you without someone manually checking every morning.
You don’t need all six on day one. Every one of these exists to answer a specific founder question, start with whichever question is the biggest unknown in your business right now, and add the rest as new questions come up. The tool is never the point; the decision it unblocks is.
Your Metrics Are One System, Not a Checklist
The numbers only matter once they change what you do next and the most useful signals come from reading them together.
One pattern worth internalizing: a high CPA combined with weak Day-7 retention is usually not a retention problem first. It’s often a positioning problem, you may be paying to acquire users for an app that isn’t differentiated enough for them to stay. Fixing onboarding flows on an app people didn’t really want doesn’t fix the economics. In that situation, the competitive question (“why should someone pick us?”) comes before the retention question (“how do we keep them?”).
That’s why measurement, retention, and competitive positioning work as one connected system. If your metrics are pointing at a stickiness problem, our guide on building apps users keep coming back to covers the retention side. If they’re pointing at a positioning problem, standing out in a crowded app market is the better starting point.

Final Thoughts
A common mistake with mobile app metrics isn’t tracking too little, it’s treating every number as equally urgent. You don’t need to watch all fifteen of these every week. You need to know which two or three are currently the biggest unknown in your business, and check those honestly, even when the answer isn’t what you hoped for.
If you take one thing from this guide: don’t look at any of these numbers in isolation. CPA next to LTV. Churn next to retention. Reviews next to NPS. The pairing is where the real signal is, a single metric almost always tells you less than it seems to.
These numbers won’t fix themselves but not every issue they surface is a build problem. Some point to positioning or pricing; others point to something in the product itself, like a feature nobody uses or an onboarding flow that’s losing people. When it’s the latter, Technology Rivers’ custom software development team can help you build the fix.